The magnetic South Pole is also heading north; Antarctica is heading towards the equator

Opmmur

Time Travel Professor
Messages
5,049
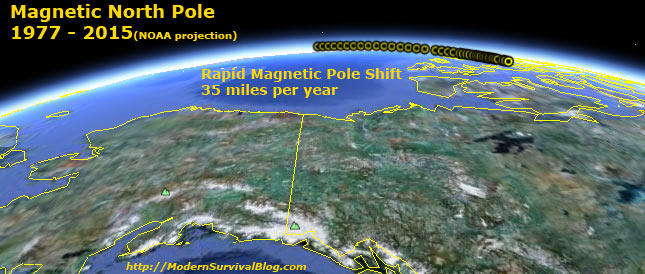
I have been following the movement of magnetic North and magnetic South for about 6 to 7 years now. Everything on the Internet stopped plotting the movement for each year after 2001. All information from 2002 through 2012 and beyond is not available. The way things are going the Magnetic North Pole will be in Russia in 30 or 40 years. Chicago, Illinois will be about where Dallas, Texas was in 2000. United States are starting to become warmer in the winter months and shorter winters with little or no snow in places that normally has a lot of snow.

The magnetic South Pole is also heading north; Antarctica is heading towards the equator. Asia and parts of Europe are starting to see severe climate changes the winters are getting colder and longer.

All of the governments of this planet: refuse to speak publicly about the climate changes due to pole reversals or magnetic North moving south and magnetic South moving north. I am not sure if the magnetic poles movements are going to cause a pole shift of true North or the axis the earth spins on.

One interesting fact the ring of fire in the Pacific is becoming more active with earthquakes than before in recent years. I believe the oceans of the world could rise quite quickly when you factor in Iceland heading south and Antarctica heading north the snow and ice melt would also be accelerated. How much and how soon is really the question: the surplus Ice water pouring into the oceans of the world.
 

Opmmur

Time Travel Professor
Messages
5,049
Be Aware and Be Prepared
Pole Shift Data Coverup – 2012

March 11, 2012, Submitted by: Ken (Modern Survival Blog)


The NOAA National Geophysical Data Center has updated (revised – massaged) their magnetic north pole-shift positional data and has projected the location of the magnetic north pole through 2015. The pole shift continues to race along in the same direction since it dramatically accelerated back in the mid 1990′s. But… NOAA made some significant and apparently linear changes to the pole location data going back to the years 2001 through 2010. The most noticeable result of the changes that they made was an overall linear slow down of the shift during the past decade, although still at a high rate of speed. They have projected positional data through 2015 and have slowed the pace of movement each subsequent year from 30 miles (2012) to 24 miles (2015).

Survival Seed Vault – Heirloom Emergency Survival Seeds
ir

No apparent reason for the change was listed. A 10 year change nonetheless! Given the fact that they suddenly changed their previously posted data of the previous decade to indicate a slower pole-shift progression, they are now able to project a slowing trend through 2015. The situation is beginning to look like one of their sister agencies, the USGS, who when they change their earthquake magnitude numbers, they always (95% of the time) revise them downward. The revisions made are nearly always in a ‘less alarming’ direction.

The following map shows the position of the magnetic north pole, and its shift since 1977. Read here for the past 400 years of magnetic north pole shift. Clearly it can be seen where the annual pole location begins to spread during the mid 1990′s when the acceleration rapidly increased.


The following image plot shows the comparison between the original magnetic north pole locations and now the new revised locations (2001 onward) from NOAA (National Oceanic and Atmospheric Administration).


While this could be the result of a NOAA factoring error of some sort, one wonders why it wasn’t caught at any other time between 2001 and today. It took 10 years to find it? Hmmm…
Or, could this be a coverup to slow the progress of the messaging of the ongoing pole shift?

SAS Survival Handbook, Revised Edition
ir


I suppose we won’t know the truth until the pole flip.
previous NOAA data revised NOAA data
Latitude Longitude year Latitude Longitude
80.815 -109.568 2001 80.772 -109.478
81.268 -110.89 2002 81.225 -110.807
81.714 -112.344 2003 81.67 -112.268
82.193 -114.095 2004 82.149 -114.026
82.623 -115.892 2005 82.578 -115.83
83.127 -118.178 2006 82.996 -117.828
83.579 -120.578 2007 83.443 -120.273
83.981 -123.067 2008 83.838 -122.814
84.37 -125.881 2009 84.218 -125.681
84.742 -129.077 2010 84.548 -128.62
2011 84.86 -131.91
2012 85.154 -135.594
2013 85.396 -139.28
2014 85.618 -143.339
2015 85.791 -147.264

Source: NOAA National Geophysical Data Center (NGDC) | ngdc.noaa.gov

Note this author does not know for certain if NOAA themselves changed the numbers, or if the new data came from another source prior to NOAA processing. We also do not know the details as to why it was changed. This is simply an observation and commentary of the apparent new facts.
 

titorite

Senior Member
Messages
1,974
It comes faster and hopefully their is nothing man can do about it...

I get kinda parinoid thinking about what man CAN accomplish via HAARP and GWEN and other arrays like what China is sporting... strange stuff that...I get ancy thinking about the leaders working together to stop the flip...to maintain the status quo. How much worse off the world would be for it.
 

Octavusprime

Member
Messages
461
Im also guessing that this change in the direction of magnetic north is effecting the ocean currents. These currents are major drivers in the weather. It has been hypothesized that the increases in storms in some regions and decreases in others is directly correlated with the measured ocean current changes in particular, its velocity and flow dynamics.
 

Top